Six Sigma in pig production: Process mapping
According to Oxford Languages, a process is a “systematic series of mechanized or chemical operations that are performed in order to produce something”. But processes are more complex. Depending on their amplitude, they can include from 2 or 3 variables to 20 or more.
To improve the process performance, it is essential that all team members have a clear understanding of each and every one of the phases. In a process, as in life itself, if the first link fails, the successive ones will never reach their full potential, which translates into a significant loss of quality. Ultimately, customer dissatisfaction.
Six Sigma is a methodology initiated in 1988 by Bill Smith, Motorola engineer, which comes from this premise:
To improve a process (and do it continuously), we must make the most of it to avoid unforeseen events and detect all the points where improvements can be applied both in the short and long term.
Once we know the operation of a system and each professional understands their role, that is when we can implement a Six Sigma project, whose purpose is to increase productivity and profitability, focusing on the quality improvement of the production system.
Animal production systems are highly complex and there are numerous factors that interfere with results. Uncertainty and variability can be generated by the inherent variability in the animals, by the degree of subjectivity of the workers, by the measurement systems … To deal with this situation, there are numerous management tools and methodologies that help to make decisions.
Process mapping
Techniques such as process mapping help us understand and improve the process. A process map is a management tool that is used to visualize the workflow of a certain process, where the steps and variables that influence it are shown.
There is no doubt that adequate process measurements are essential. As we analyze processes we can detect that some measurements are inaccurate or missing, or that different things need to be measured.
These measurements will result in sets of variables of which a small number are ultimate of interest, which are called Critical To Quality (CTQ).
In this article, we give an example of what a Six Sigma process map would look like for a breeding sow farm and determined the CTQs.
Process map in a pig farm

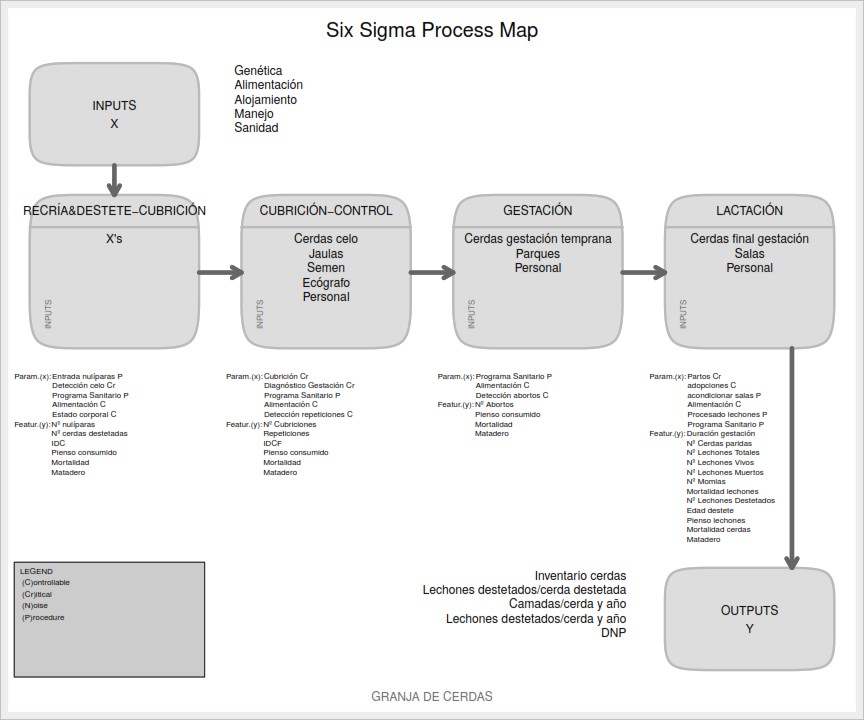
Figure 1: Example of a Six Sigma process map in a breeding sow farm
As we see, the process map of a Six Sigma project is organized and divided into several phases in order to ensure that we won’t forget any important factor and that we will follow the necessary steps.
First, the general inputs (X) of a farm are identified, which are subsequently key to determining the most important outputs (Y): CTQs. In such a way: Y = f (X)
INPUTS (X)
- Genetics
- Feeding
- Accommodation
- Driving
- Health
Una vez los inputs son seleccionados, pasamos a la segunda fase, la cual se divide en sí misma en cuatro pasos. Antes de analizar una a una, es importante definir lo siguiente:
Once we have the inputs, we proceed to the second phase, which is divided into four steps. Before analyzing them, it is important to define the following:
Within each stage, we classify a series of parameters (Param.) and characteristics (Featur.):
- Param. = Factors that influence the characteristics of the process.
- Featur. = Characteristics that define the quality of the process.
Each stage of the process generates outputs (X’s) that will be inputs (Y’s) in the following stage.
Then, the stages we find are the following:
1. BREEDING AND WEANING – SERVICE
Param .: Nulliparous entry (P), heat detection (Cr), health program (P), feeding management (C), body condition (C).
Featur.: Number of gilts, number of weaned sows, Weaning Interval Cover, feed consumed, mortality, sows sent to slaughterhouse.
Output: Number of sows in heat.
2. SERVICE – CONTROL
Param .: Insemination (Cr), gestation diagnosis (Cr), sanitary program (P), feeding management (C), repetition detection (C).
Featur .: Number of services, number of repetitions, weaning interval, fertile mating, feed consumed, mortality, sows sent to slaughterhouse.
Output: Number of sows that become pregnant in early gestation.
3. GESTATION
Param .: Sanitary program (P), feeding management (C), abortion detection (C), batch formation (C).
Featur .: Number of abortions, feed consumed, mortality, slaughterhouse.
Output: Number of pregnant sows at the end of gestation.
4. LACTATION
Param .: farrowing (Cr), adoptions (C), housing conditioning (P), feeding management (C), piglet processing (P), sanitary program (P)
Featur .: Gestation duration, No. sows farrowing, No. total piglets, No. live piglets, No. dead piglets, No. mummies, piglet mortality, weaned piglets, weaning age, sow mortality, slaughterhouse, feed consumed sows, feed consumed piglets
Output: with this last step we can the OUPUTS (Y) or CTQ.
OUTPUTS (Y)
- Sow inventory
- Weaned piglets / weaned sow
- Litters / sow.year
- Weaned piglets / sow year
- Non-Productive Days
And now.. what?
Once we have defined our process, we can begin to ask questions: Where are more failures being generated? Which parts of the process should I redesign to solve the most common (or serious) problems? Where are resources being wasted? And so on.
Six Sigma is divided into the following phases: Define, Measure, Analyze, Improve, and Control (DMAIC). If you want further explanations of these phases, check our post about the Six Sigma strategy.
Statistical Process Control (SPC) as a measure to improve quality
In our previous article, we introduced Statistical Process Control (SPC) and solved a use case with the Síagro program. This type of analysis is the basis for Six Sigma projects and is useful for developing process maps, since with control charts we can monitor a process, control assignable variability and detect changes.
Control charts are especially useful for developing productivity diagrams, a tool with which the different variables that influence the performance of a farm are visualized and which allows us to know the weight and influence of each one, as well as the existing relations.
In the next article, we will develop a productivity diagram. If you don’t want to miss it, subscribe to our newsletter and we will send you a notification!


