Interpreting results of Scientific Articles
Article published in AviNews | Also available in ![]()
In 2017, Bradbury et al. published an article in Animal Production Science, number 57, pages 2016 – 2026, where they analyzed the effects of a highly soluble calcium source supplemented with phytase in chicken diets and studied the digestibility of various nutrients, ash content, mobility of animals and weakness of the legs.
The selection of this study for this article is not to compare it with other experiments, but to simply use it as a model on how to analyze and interpret biostatistics in such a publication:
What kind of data should a publication provide us with?
What do the different results obtained in the studies tell us?
How should we interpret them?
A scientific article should, in addition to informing us of a series of findings made by the authors, be a guide that allows other researchers, following the same (or similar) methods and materials reach (or not) similar conclusions. than the authors thereof.
What should we look for when reading an article?
Bradbury et al. in table 3 of their article, reported the effect of phytase levels between days 1 to 14, using a 2 x 2 x 2 factorial design (two sources of calcium, two levels of calcium and two levels of phytase, see table 1).
| Phytase level (FTU/kg) | Weight gain (g/bird) | Feed consumption (g/ave) | Live weight/feed conversion ratio (g/g) |
|---|---|---|---|
| 0 | 480 | 546 | 1,27 |
| 500 | 502 | 561 | 1,23 |
| Valor de P | < 0,001 | 0,01 | < 0,001 |
Table 1: Influence of dietary treatment on the productive results of chickens during the period of 1 to 14 days of life (modified from Bradbury et al. 2017).
The mean is a descriptive statistical parameter of a population. There are multiple descriptive statistical parameters such as mean, standard deviation, proportion, etc.
At the beginning of the experiment, the authors or ourselves did not know the real data of the weight gain, the consumption and the conversion index of the total chicken population (Cobb-500 in this case). From the 1120 chickens used in this experiment, we collect the samples, and estimate the value of the statistical parameter of interest, in this case the mean.
Would we always get the same results when testing a sample of 1120 Cobb-500 chickens?
Of course not, they can be very similar, but not the same, that is why the value we obtain from a sample is called the estimate of the mean and as such has an associated error.
The value of the statistic (the mean) of the sample is used to estimate the value of the unknown parameter of the population. If the samples are random, the statistics give unbiased point estimates of the corresponding parameters [1].
However, as a result, the point estimate does not give us enough information about the test.
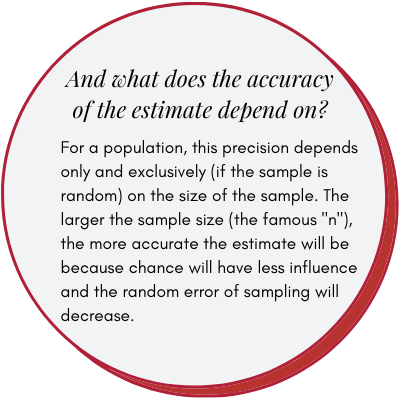
It is essential that each estimate (mean, proportion, etc.) is always accompanied by its precision (or its estimation error) which will give us an idea of how good our estimate of the true value is, a value that we will never know.
Suppose that…
…we repeat Bladbury’s study and take 1,120 chickens, divide them into two groups at random, and obtain the weight gains between 1 and 14 days.
We have simulated this and have obtained the following results:
| Phytase level (FTU/kg) | Number of birds | Average weight gain (g/bird) | Standar deviation (g/bird) | Standard error of the average (g/bird) |
|---|---|---|---|---|
| 0 | 560 | 477 | 35 | 1,48 |
| 500 | 560 | 500 | 39 | 1,64 |
Table 2: Simulation of the Bladbury experiment
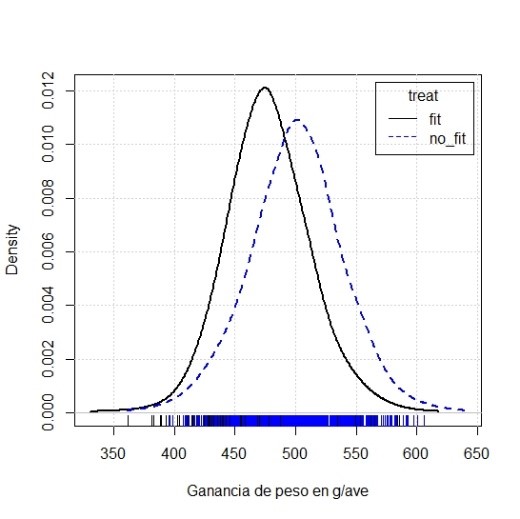
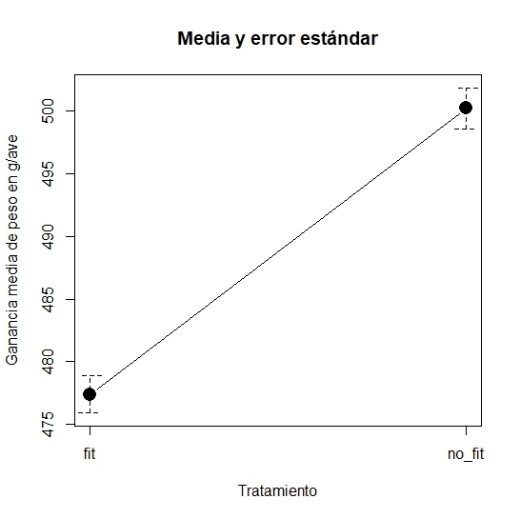
Table 3. Density distribution of both with and without phytase treatments.
What is the standard deviation?
Es un parámetro que describe la variabilidad de los datos y es necesario para conocer la precisión de nuestro muestreo. Como en el caso de la media, no conocemos la desviación estándar de la población, sino que la estimamos a partir de la muestra. Para el cálculo de la desviación estándar muestral se resta de cada uno de los valores de nuestro muestreo, la media estimada. Para que la suma de las diferencias no sea 0, elevamos al cuadrado esta diferencia. Finalmente dividimos por el número de datos “n” menos uno. Matemáticamente, su fórmula es:
It is a parameter that describes the variability of the data and is necessary to know the precision of our sampling.
- As in the case of the mean, we do not know the population standard deviation, but we estimate it from the sample.
- To calculate the sample standard deviation, the estimated mean is subtracted from each of the values of our sample.
- So that the sum of the differences is not 0, we square this difference.
- Finally we divide by the number of data “n” minus one.
Mathematically, the standard deviation formula is:

Formally:

What is the standard error of the mean?
If we randomly sample each group a large number of times, from each sample, we obtain a mean.
- These values will not be equal to each other, and their variability, measured as standard deviation, is the standard error of the mean.
- If we measure a variable with very small variability (all chickens are equal, very low standard deviation) the variability of the means in different tests will also be small.
- On the other hand, if the measured variable has a lot of variability (high standard deviation), the means of each test will also differ more.
Thus, formally, the standard error of the mean (SEM) estimated in a population with standard deviation “s”, and a sample size “n”, is:

If we think that our random variable by virtue of being so follows the famous Normal Law, 95% of the values of the weight gains of the chickens within each of the groups will be approximately between the value of the mean of their group and 2 times (formally the value is 1.96) the value of the standard deviation.
For both groups:
| Phytase level (FTU/kg) | Normal range of weight gain (g/bird) |
|---|---|
| 0 | 477 ± 2 * 35 = 407 a 547 |
| 500 | 500 ± 2 * 39 = 422 a 578 |
Table 4: Normal range, between whic 95% of the sample value are found
Y a este intervalo se le denomina intervalo de normalidad. Pero si lo que queremos conocer es la precisión de la muestra media, lo que debemos hacer es obtener el intervalo de confianza. En este caso se suma y se resta a la media 2 veces el error estándar de la media.
And this interval is called the normality interval. But if what we want to know is the precision of our average, then we bust obtain the confidence interval. In this case, we add and subtract to the mean 2 times the standard error of the mean.
| Nivel de fitasa (FTU/kg) | Intervalo de normalidad de la ganancia de peso (g/ave) |
|---|---|
| 0 | 477 ± 2 * 1,48 = 474 a 480 |
| 500 | 500 ± 2 * 1,64 = 497 a 503 |
Table 5: Confidence interval. Among the values found, with 95% confidence the population average.
And this interval is called the the 95% confidence interval of the mean.
If the values of the intervals obtained without phytase or with 500 FTU of phytase do not overlap, intuitively we can already see that the mean of treatment without phytase will be below the mean of treatment with 500 FTU of phytase, and therefore we attribute treatment effect not due to chance (statistically significant).
We can also intuitively see that, the narrower the interval, the smaller the sampling error will have been and we will have more confidence in our data.
Is this difference in intervals important?
Is this difference in intervals important?
In statistics, a result or effect is statistically significant when it is unlikely that it was due to chance.
A “statistically significant difference” means that there is statistical evidence that there is a difference; it does not mean that the difference is great, important or radically different.
This difference is given by the size of the effect of the difference.
The statistically significant difference is defined with a value known as the “p” value and is the statistical probability of obtaining by pure chance, in this case, an average weight gain as far as or further from 477 g / bird (group without phytase) than the mean 500 g / bird (phytase group).
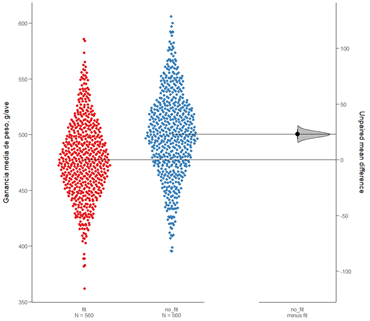
Tabla 6. Distribution and estimation of the size of the effect.
What does 95% mean?
If we sampled chickens 100 times (1,120 chickens taken at random 100 times and put on the same diets), each sample would give us a mean and a confidence interval.
Eventually 95% of these ranges would include the true mean value of actual weight gain, which we will never know.
We can never know if the interval obtained in the experiment belongs to the 95% of the intervals that include the true mean or the remaining 5% that do not: it is the method that is correct 95% of the time.
Thus, when reporting the results of experiments, the authors should give us, in addition to the calculated statistics (mean, proportion …), the number of observations in each data set, their standard error, their confidence interval and the value of the statistical significance.
Authors: Morillo Alujas, Alberto ; Villalba Mata, Daniel ; Mehaba, Nabil ; Nadal Zuferri, Sergio

This work is licensed under a Creative Commons Attribution-NonCommercial-NoDerivatives 4.0 International License.
References
[1] Domenech, J.M.1996. Métodos estadísticos en ciencias de la salud. Cap.5, 7.

